SEE THE CHARTS BELOW FOR CURRENT CLIMATE RELATED INFORMATION
The GWPT Bear System helps to obviate methane emissions coming from landfills that contribute significant greenhouse gases to the atmosphere.
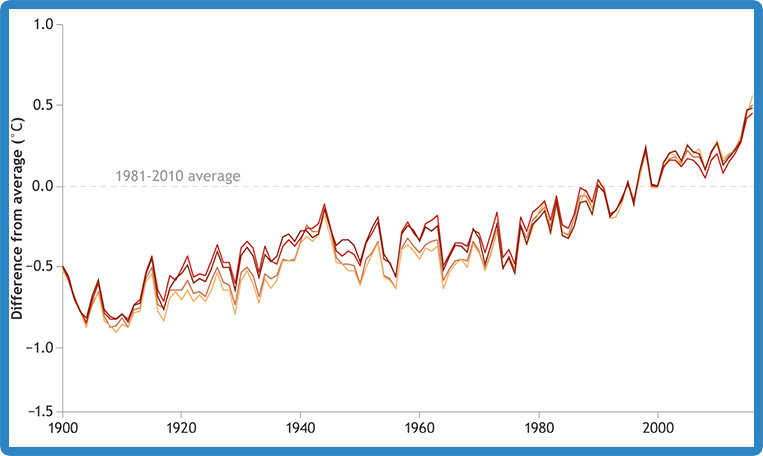
Temperature change graph relative to recent average
This graph illustrates the change in global surface temperature relative to 1981 to 2010 average temperatures. Seventeen of the 18 warmest years in the 136-year record all have occurred since 2001, with the exception of 1998. The year 2016 ranks as the warmest on record. (Source: NASA/GISS). This research is broadly consistent with similar constructions prepared by the Climatic Research Unit and the National Oceanic and Atmospheric Administration.
The planet's average surface temperature has risen about 2.0 degrees Fahrenheit (1.1 degrees Celsius) since the late 19th century, a change driven largely by increased carbon dioxide and other human-made emissions into the atmosphere. Most of the warming occurred in the past 35 years, with 16 of the 17 warmest years on record occurring since 2001. Not only was 2016 the warmest year on record, but eight of the 12 months that make up the year — from January through September, with the exception of June — were the warmest on record for those respective months.
 Source: NASA
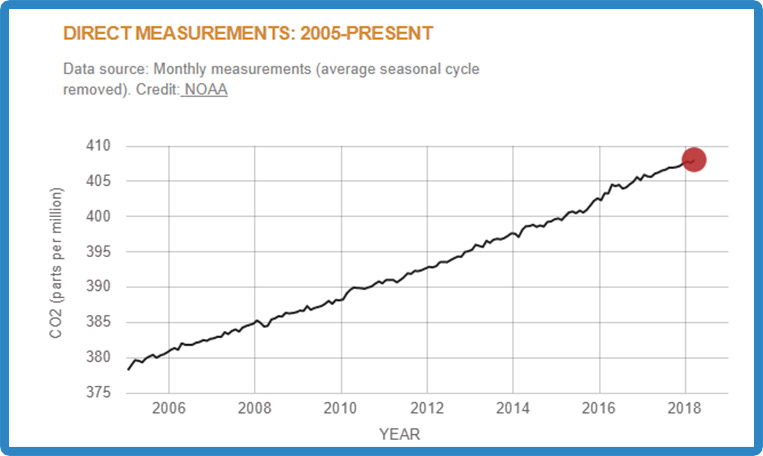
Recent CO2 measurements graph
Shows parts per million of CO2 in our breathable atmosphere in recent times escalating from 378 ppm in 2005 and 406 ppm now in 2018. CO2 levels begin to affect human respiration negatively as they approach 1200 ppm.
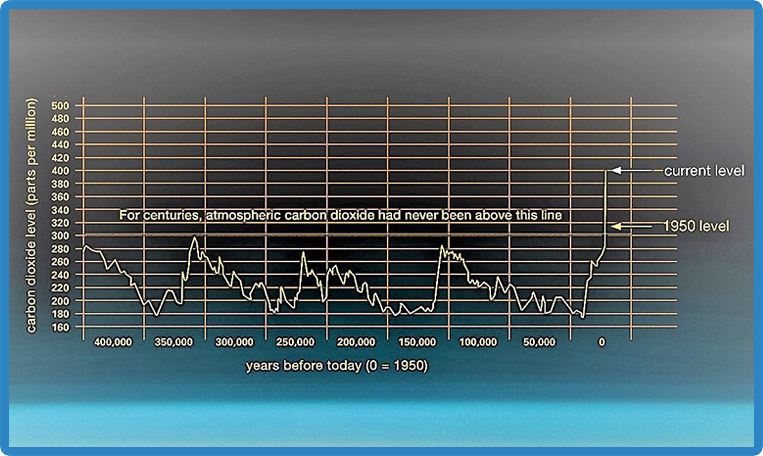
Historical CO2 measurements graph
Shows parts per million of CO2 in our breathable atmosphere recorded from ice core samples taken at depth in the arctic from verified glacial periods extending back 400,000 years ago. The graph shows CO2 never exceeding 300 ppm until 1950. In a mere 68 years since then the concentrations have increased by over 35% to upwards of 406 ppm.
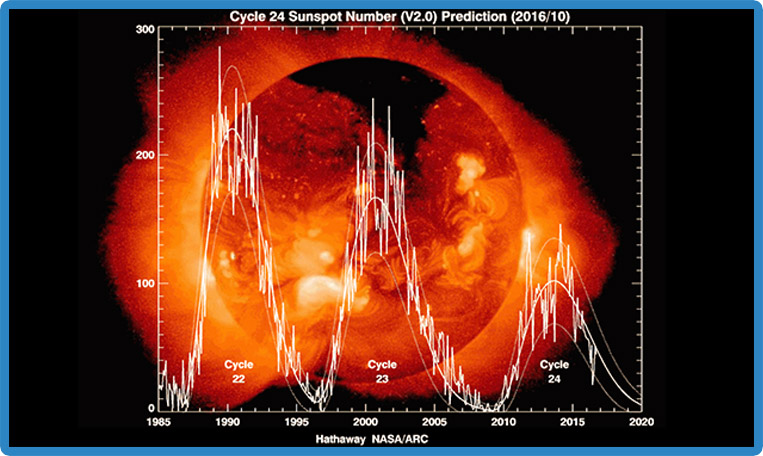
The solar cycle graph
The solar cycle or solar pulse was discovered in 1843 by Samuel Heinrich Schwabe, who after 17 years of observations noticed a periodic variation in the average number of sunspots. Rudolf Wolf compiled and studied these and other observations, reconstructing the cycle back to 1745, eventually pushing these reconstructions to the earliest observations of sunspots by Galileo and contemporaries in the early seventeenth century.
Following Wolf's numbering scheme, the 1755–1766 cycle is traditionally numbered "1". Wolf created a standard sunspot number index, the Wolf index, which continues to be used today. Studies referencing the ‘Period’ of the sun confirm todays 11.5 year cycle while projecting backwards in time to a 3 year solar Period existing at the time of the creation of our solar system 5 billion years ago.
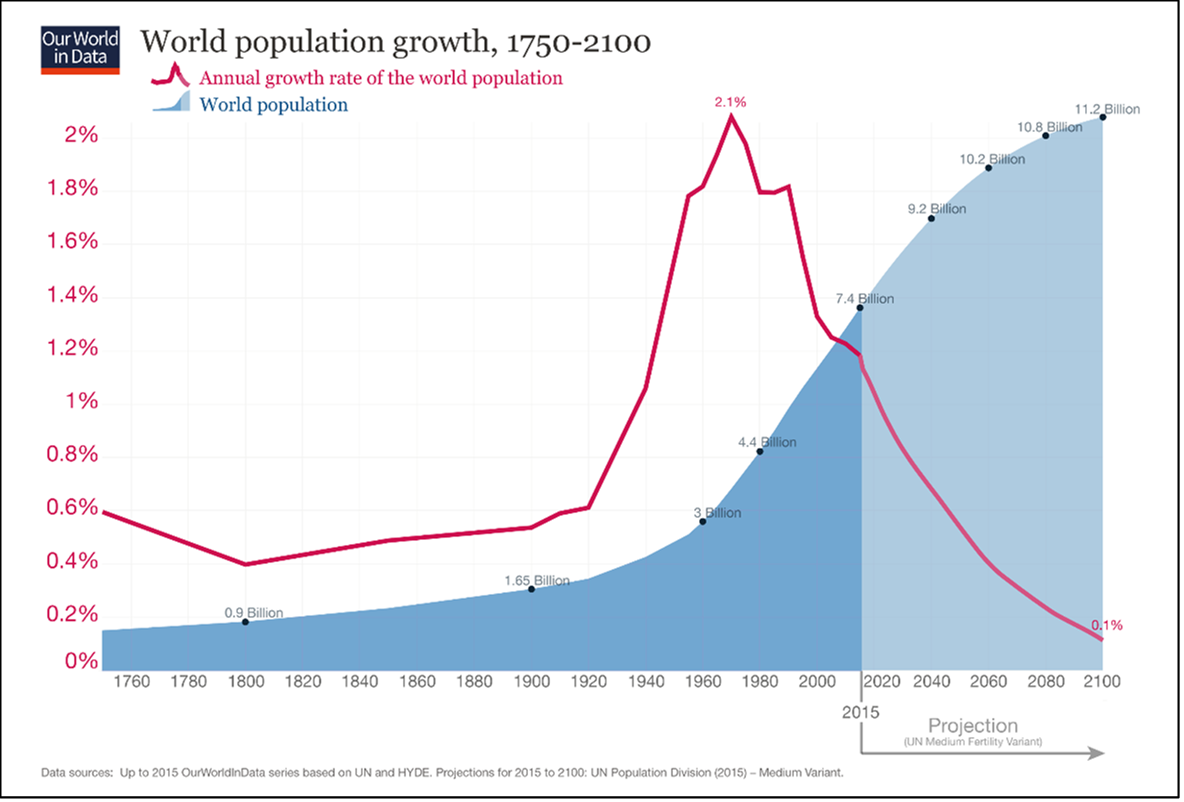
Population growth rates are reducing globally due to increased education and mechanization factors, but the population projection is still shown to increase until about the 11 billion person mark at which time a reduction is anticipated.
Click here for Intergovernmental Panel on Climate Change URL and associated reports.
IPCC reports and other factors
Many factors influencing the earth's climate and 'heat locations' over geologic time periods such as Precession, Eccentricity and Axial Tilt are shown not be total solar gain factors on earth...Download PDF here